User-Based Data Security Setup in AIV
User-Based Data Security in AIV allows you to restrict data visibility based on the logged-in user. By configuring security rules within a dataset, each user can view only the records they are authorized to access.
This guide demonstrates how to implement user-specific data access using the getOwner() function and dataset parameters.
Business Scenario
Assume your organization stores sales data for multiple countries. Different users should have access to different sets of data.
| Username | Data Access |
|---|---|
| Demo access | Access to all countries |
| USA | Access to USA records only |
| Germany | Access to Germany records only |
| FranceSpain | Access to France and Spain records only |
You can replace these example users with your own usernames and customize the security logic according to your business requirements.
Prerequisites
Before starting, ensure that:
- Users have been created in AIV
- A data source is available and connected
- Your dataset contains a column that can be used for security filtering
- You have permission to create datasets, visualizations, and dashboards
Step 1: Create Users
Create the users that will access the dashboard.
User Creation Guide: Create User
Create the following users for this example:
- Demo access
- USA
- Germany
- FranceSpain
After creation, verify that all users appear in the user management section and are active.
Step 2: Prepare the Dataset
Your dataset must contain a field that can be used to identify which records belong to which user.
Dataset Creation Guide: Create Dataset
Example Dataset Structure:
| Customer | Country | Sales |
|---|---|---|
| ABC Ltd | USA | 1000 |
| XYZ GmbH | Germany | 1500 |
| Demo SARL | France | 1200 |
| Global SL | Spain | 900 |
For this example, the country column will be used to control data access.
Step 3: Create the Dataset
-
Open the
 (Hamburger Menu), navigate to Master Data → Datasets.
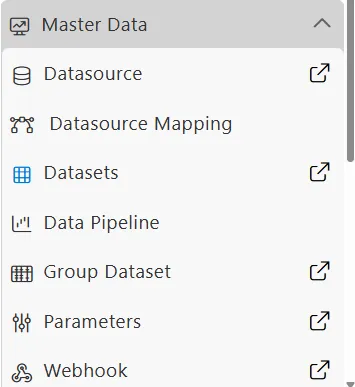
-
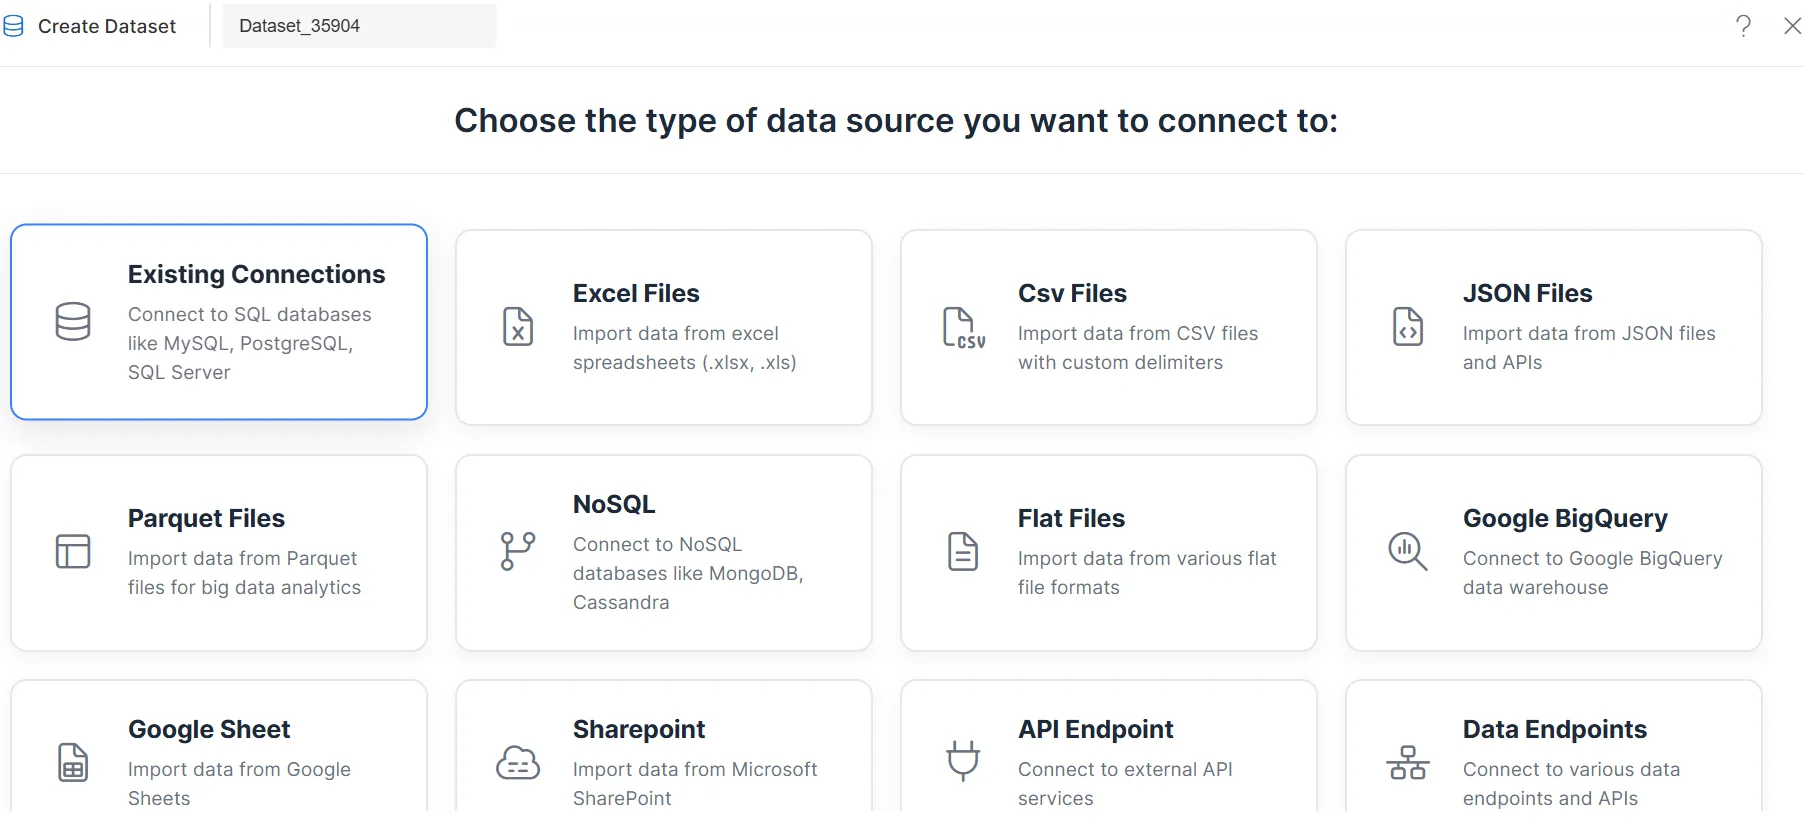
Select Create Dataset from the bottom toolbar.

-
Choose the required data source.
Example: Select an Existing Connections data source from the available options.
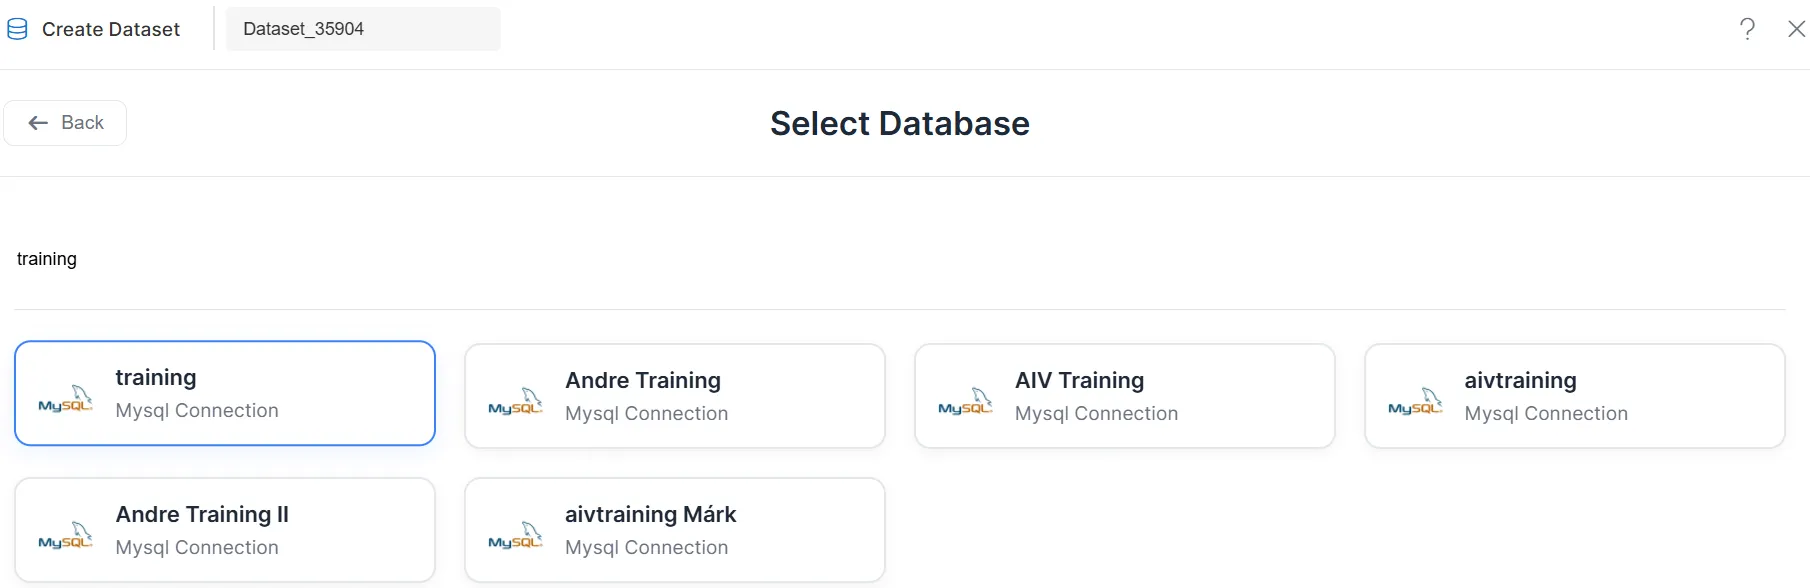
-
Select the specific database connection.
-
Open the query editor to create or edit the dataset query.
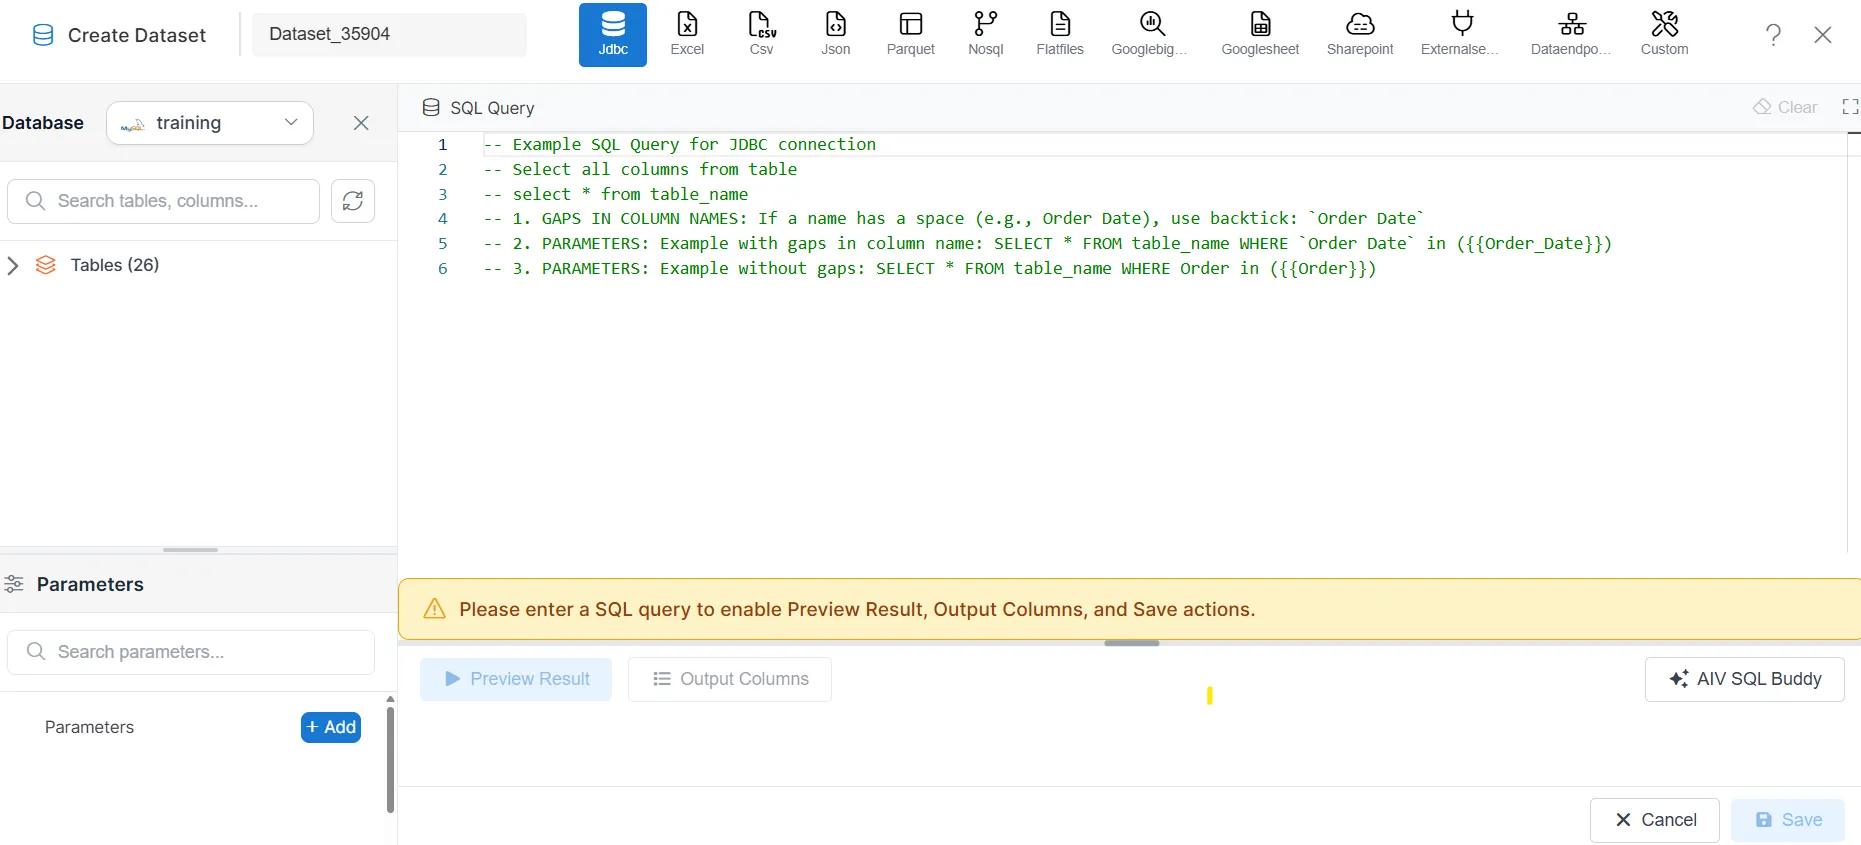
Step 4: Add User-Based Security Logic
Apply security conditions directly within the dataset query.
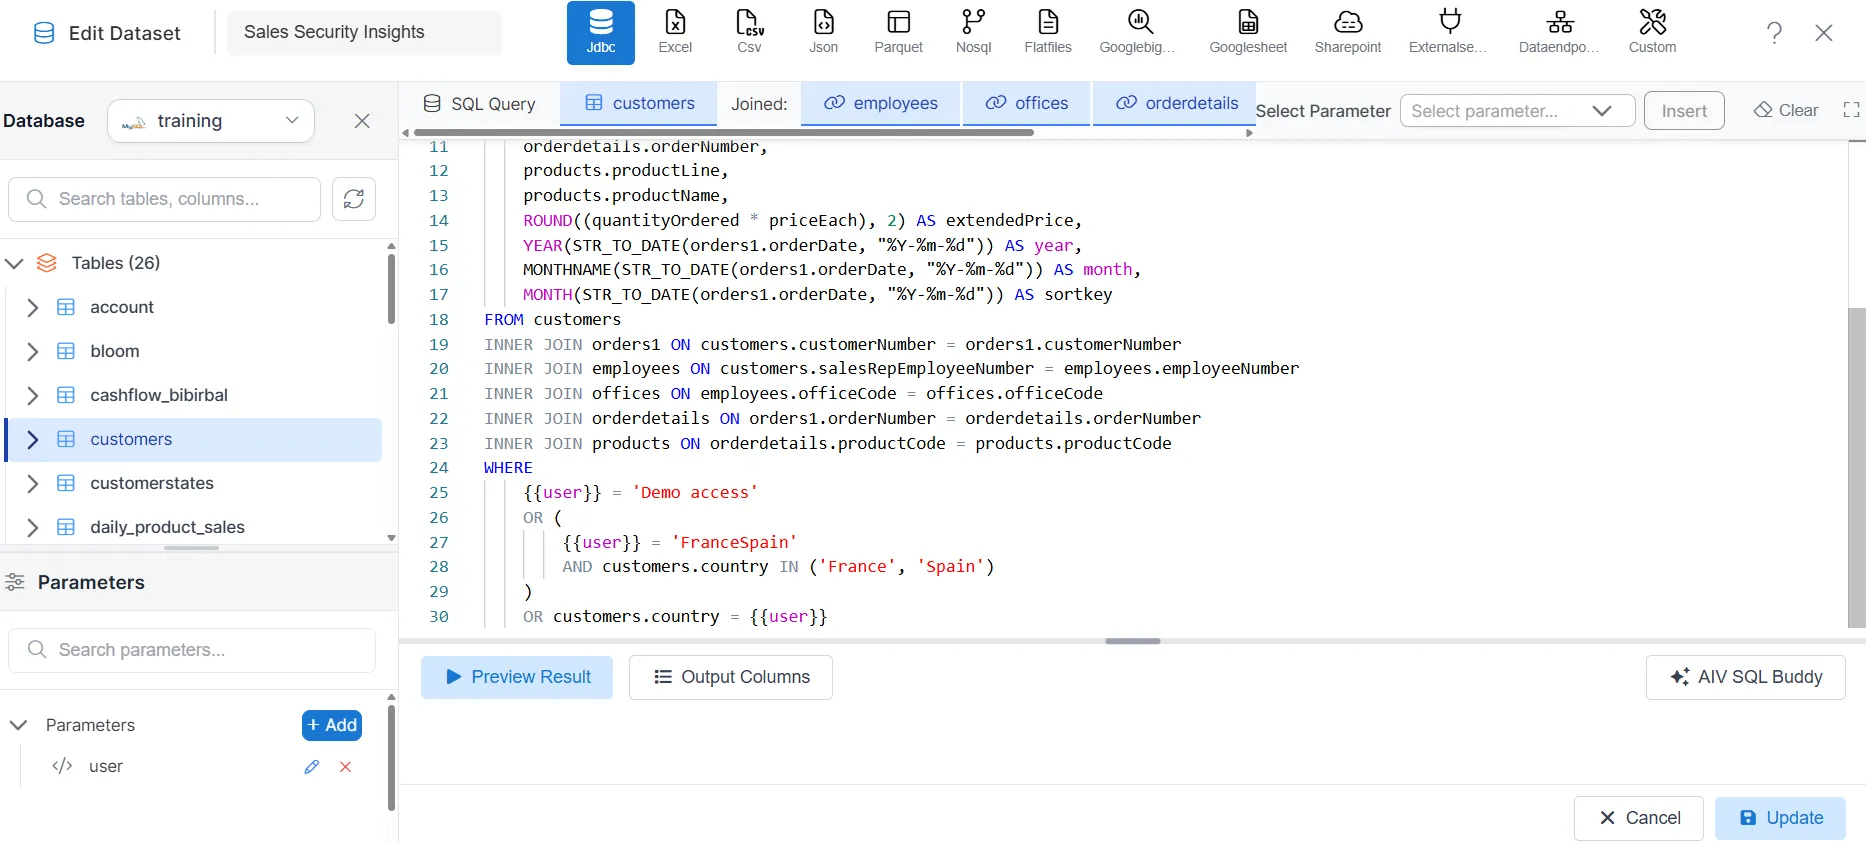
Security Query Example
WHERE
    {{user}} = 'Demo access'
    OR (
        {{user}} = 'FranceSpain'
        AND customers.country IN ('France', 'Spain')
    )
    OR customers.country = {{user}}
Query Explanation
The above query works as follows:
- The user Demo access can view all records.
- The user FranceSpain can view only France and Spain records.
- Any other user can view records where the country matches their username.
Simplified Security Query
If you only need:
-
Demo access
-
USA
-
Germany
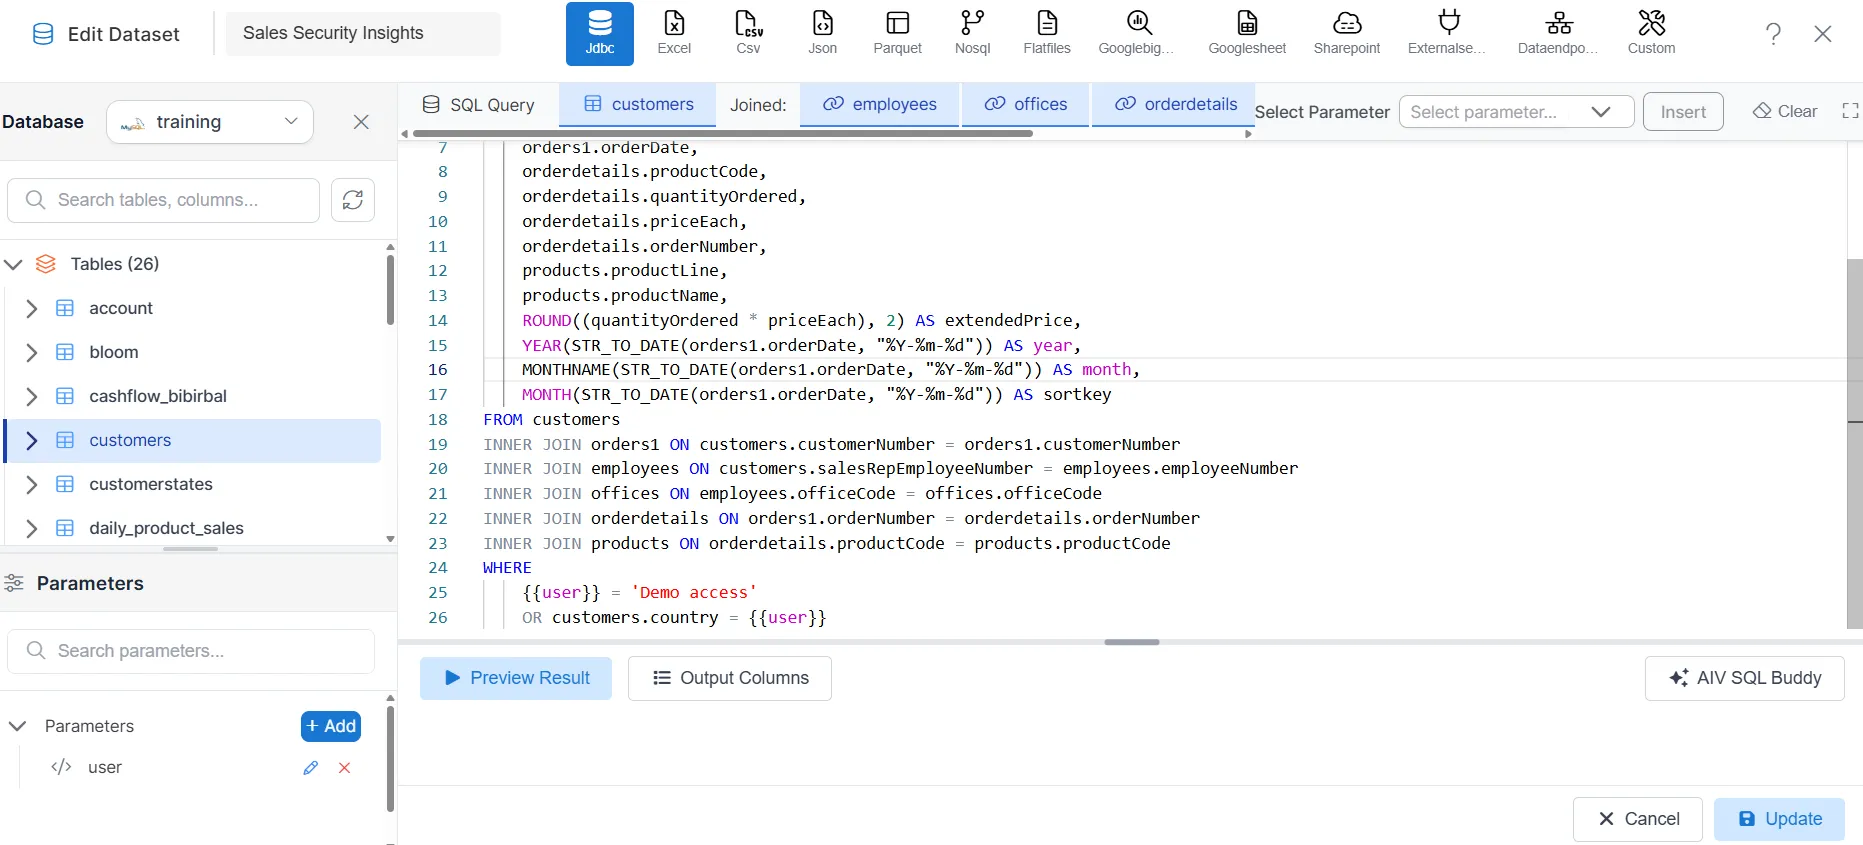
Use the following query:
WHERE
    {{user}} = 'Demo access'
    OR customers.country = {{user}}
This approach is useful when usernames directly match the values stored in the dataset.
Step 5: Configure Dataset Parameters
Parameter Creation Guide: Create Parameter
After adding the security query:
-
Open the Parameters section.
-
Create or locate the parameter named:
{{user}} -
Set the Default Value to:
getOwner()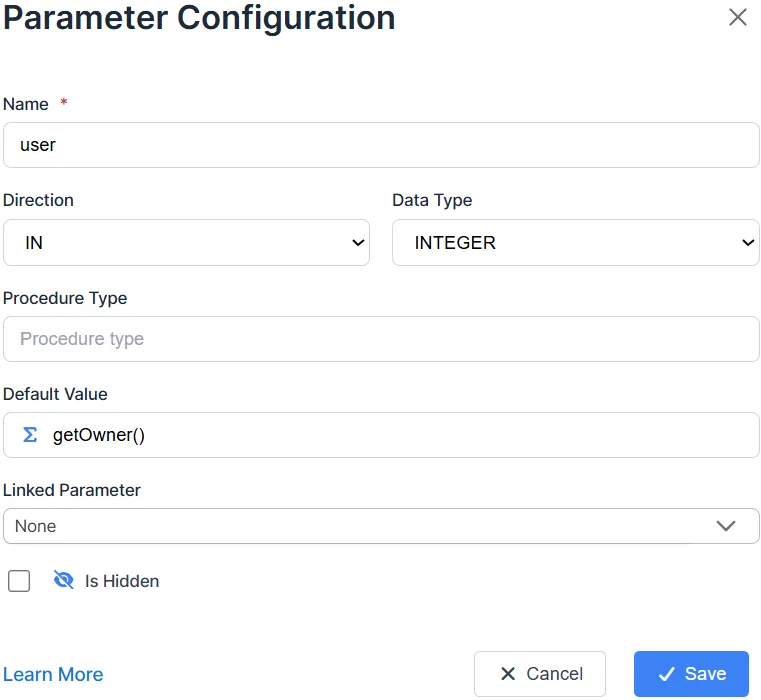
Why Use getOwner()?
The getOwner() function automatically returns the username of the currently logged-in user.
This allows AIV to dynamically apply the correct security filter without requiring manual user selection.
- Save the parameter.
- Preview the dataset.
- Verify that the returned data changes based on the logged-in user.
Step 6: Validate Dataset Security
Before creating visualizations, test the dataset output.
Verify the following:
| User | Expected Result |
|---|---|
| Demo access | All records |
| USA | USA records only |
| Germany | Germany records only |
| FranceSpain | France and Spain records only |
If the results are correct, proceed to visualization creation.
Step 7: Create a Visualization
-
Navigate to the Dashboard menu and click Create Viz.
-
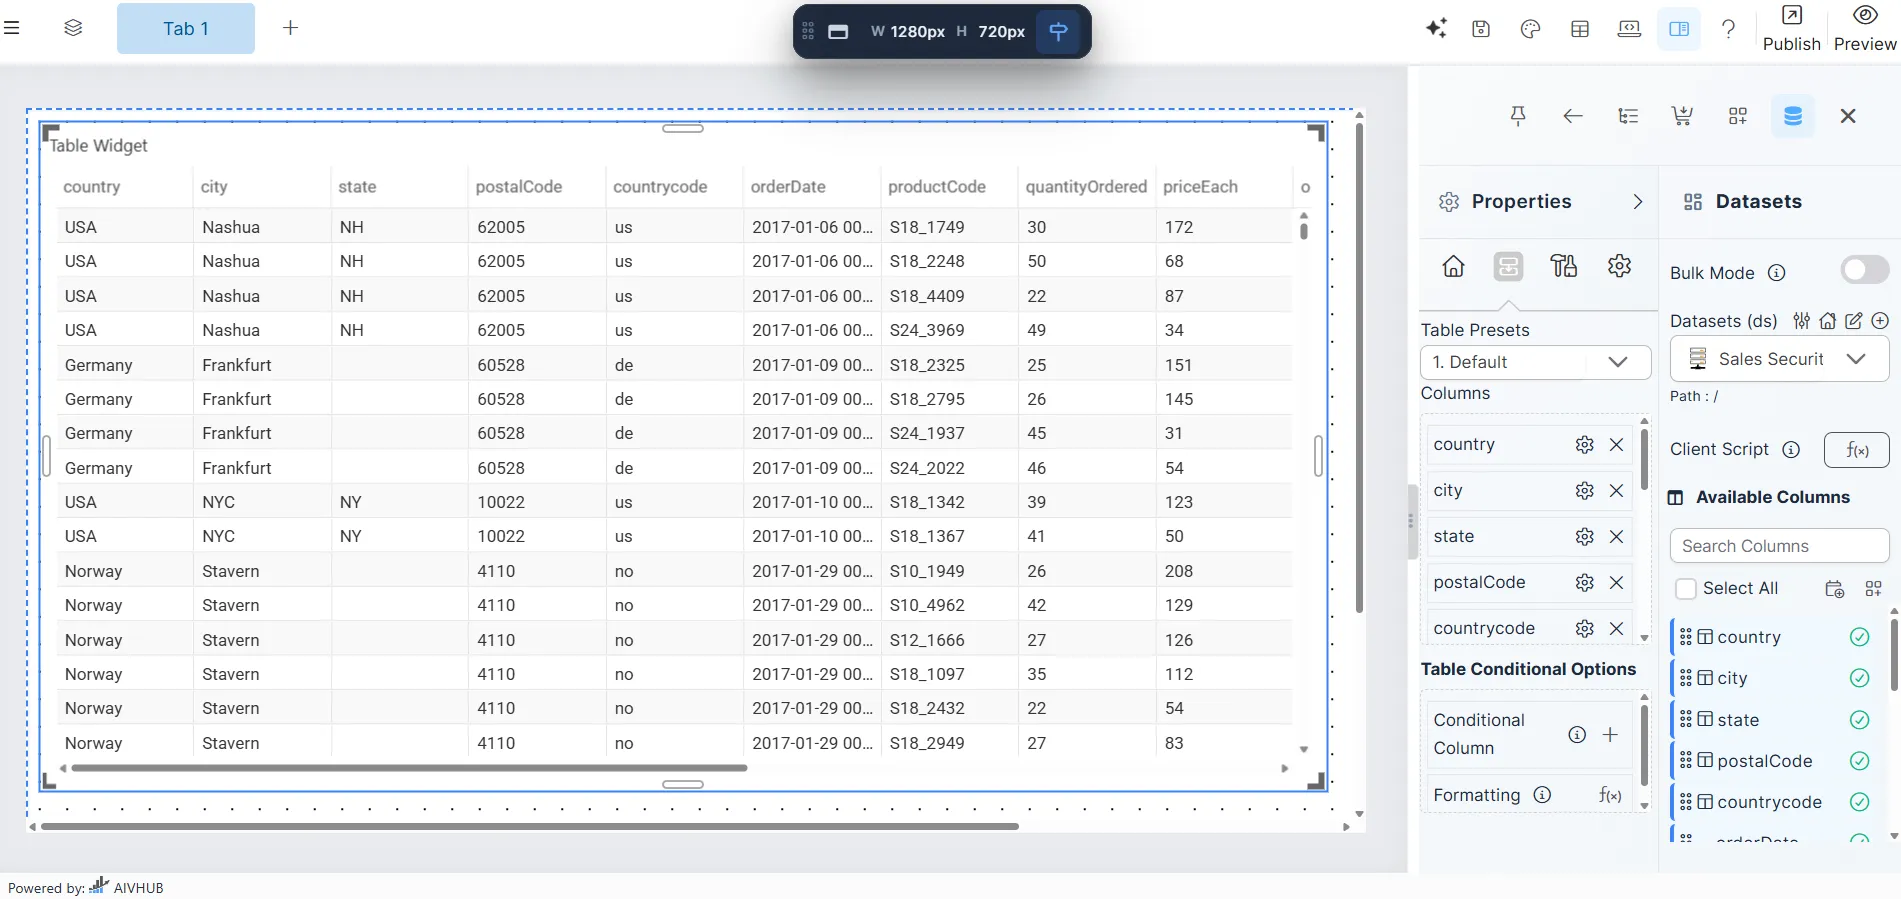
Select the Table Chart type.
-
Select the Sales Security Insights dataset.
-
Select the required dimensions and measures.
-
Configure the chart.
-
Save the visualization.
Step 8: Share the Dashboard
Share the dashboard with the required users to grant them access.
Share Guide: How to Share Dashboard
The dashboard is now available to authorized users.
Step 9: Test User Access
Log in using each user account and confirm that security is working correctly.
Expected behavior:
| User | Visible Data |
|---|---|
| Demo access | All countries |
| USA | USA only |
| Germany | Germany only |
| FranceSpain | France and Spain only |
Each user should see only the data permitted by the dataset security rules.
Complete Security Components
| Component | Value |
|---|---|
| Dataset Parameter | {{user}} |
| Dynamic User Function | getOwner() |
| Security Condition | customers.country = {{user}} |
| Administrative Override | {{user}} = 'Demo access' |
Best Practices
- Use meaningful usernames that match business rules whenever possible.
- Keep security logic inside the dataset to ensure consistent access control.
- Always validate dataset results before sharing dashboards.
- Test with multiple user accounts before moving to production.
- Document special access rules such as multi-country users.
Conclusion
User-Based Data Security in AIV provides a simple and effective method for controlling data access at the dataset level.
By combining dataset parameters with the getOwner() function, AIV automatically identifies the logged-in user and displays only the records they are authorized to view.
This approach helps organizations:
- Secure sensitive data
- Provide personalized data access
- Reduce dashboard duplication
- Simplify user management
- Maintain centralized security rules across dashboards and visualizations